State Bank of India (SBI) shares continued to be under sharp focus on Monday following the announcement by the largest lender in the country that it has registered the highest ever standalone quarterly profit which moved investors into driving the stock to a new 52 week high in intraday trade.
SBI increased over 6.5 percent to reach 1,139.70 apiece on the NSE as it continued its good run this year. The rally comes after December quarter results announced by the bank on February 7, which pointed out to healthy growth in core income, strengthening asset quality and the support of a one time dividend by one of the subsidiaries.
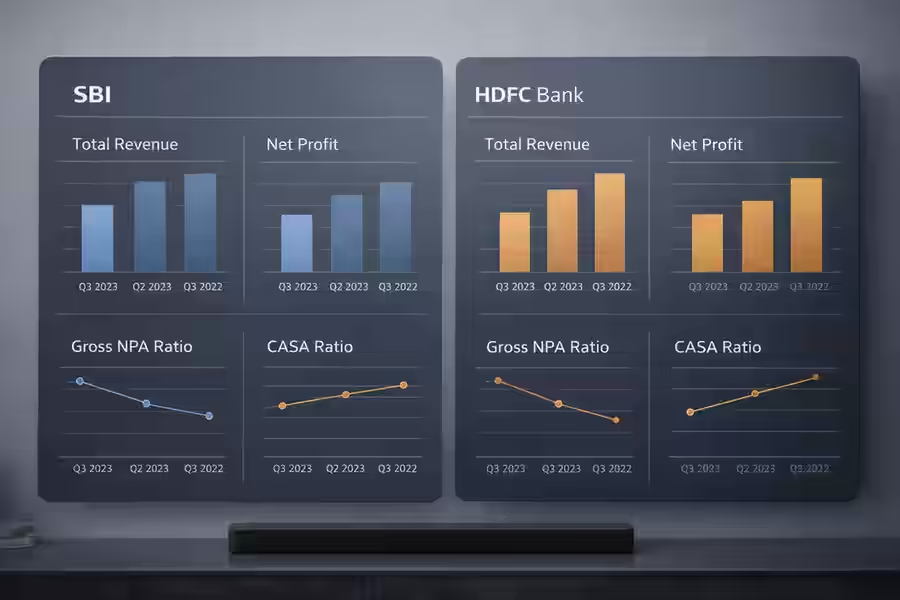
In the third quarter, SBI recorded a net profit of 21,028 crore which is 24.4 percent higher than that of a year ago. There was a special dividend of 2200 crore by SBI Mutual Fund, its investment management division that is about to get a public listing that helped to boost the figure.
After this payout, profit was 18,828 crore which can be broadly compared to the profits of the major HDFC Bank of the private sector.
The net interest income of SBI was 45,190 crore, 9 percent higher than the previous year, which is more than comfortable than HDFC Bank, which is 32, 615 crore, which was 6.4 percent higher.
The public sector lender also continued to lead in growth of loans and gross advances have grown to 46 lakh crore as compared to 28.44 lakh crore at HDFC Bank.
The profitability ratios however told a different tale. SBI had a net interest margin of 3.12 which is lower than that of HDFC Bank at 3.35 meaning that the private lender still derives optimal returns out of its assets.
Buoyed by the new trend, SBI Chairman C S Setty increased the banks loan expansion target to FY26 to 13 percent and 15 percent, higher than the previously set target of 12 percent to 14 percent. The update shows a resurgence on corporate credit demand as well as a consistent pickup in retail lending.
The quality of assets to both lenders was better in the quarter. The gross non performing asset ratio of SBI dropped to 1.57, 50 basis points lower than it was the previous year, and net NPAs decreased to 0.39.
Provisions rose to ₹4,507 crore. HDFC Bank recorded gross and net NPA of 1.24 and 0.42 percent respectively and provision of 2837.9 crore.
Absolute balance sheet is much higher with SBI having deposits of 57 lakh crore and credit deposit ratio of approximately 72%. In HDFC Bank, on the other hand, it is operating with a much stricter ratio of almost 99 which has in recent times raised eyebrows among the investors.
High loan to deposit ratio means that funds are being used well but would be a cause of concern when maintained over a long period because the banks would lack adequate liquidity buffer and would have to borrow at a higher rate in order to cover their funding needs.
The divergence of financial standings also can be observed in the performance of the stocks. Shares of SBI have increased more than 16 percent to date in the year 2026 because of the growth in business and the favorable fundamentals.
Also Read: What Nitish Rajput Alleged in SSC Exam Videos and Why Eduquity Filed ₹2.5 Crore Case
Meanwhile HDFC Bank is languishing over 5 percent this year and the mood is sour because of liquidity concerns.
As the Reserve Bank of India observes that system wide credit deposit ratio has increased to 81.6, the market will be keen on how banks will balance growth ambition with funding stability within the next quarters.